
The Ecological Footprint (EF) draws upon a long line of theory, and was created by William Rees and Mathis Wackernagel in the mid 1990s as an indicator of the sustainability of the human economy. It is a means of gauging humanity's impact upon the natural environment, a standardized measure of the consumption of renewable resources (or equivalents). EFs are based on the premise that it is possible to measure humanity's reliance and impact upon the natural world through a simple accounting of the resources consumed, and more specifically the "land" from which they are derived. It's ecological significance comes from the fact that it then becomes possible to "balance the books", as it were.
Remainder = Biocapacity - Ecological Footprint
Where each term is in global hectares (gha; 1 hectare = approx. 2.5 acres), a form of area normalized for average productivity. A positive Remainder is a "surplus" or reserve, and negative values are deficits. If we use per capita values Biocapacity is then the normalized form of:
Population Density-1
I have created cartograms of American state footprints, and national footprints (below).
The maps are labeled for the date of the source data, and not the year footprint calculations were published; typically three or four years later.
Some of the choices made when I created the 2002 global cartogram mean that this version is conceptually odd, and cannot be compared to the 2003 map. These choices also allowed a minor flaw to be introduced into the map. See Errata below for more information
 You may use or adapt the content I have created below this URI
under the Creative Commons license
specified without fee or permission, although I would appreciate being notified. Also contact me for other licensing terms.
You may use or adapt the content I have created below this URI
under the Creative Commons license
specified without fee or permission, although I would appreciate being notified. Also contact me for other licensing terms.
Use the SVG format for publishing.
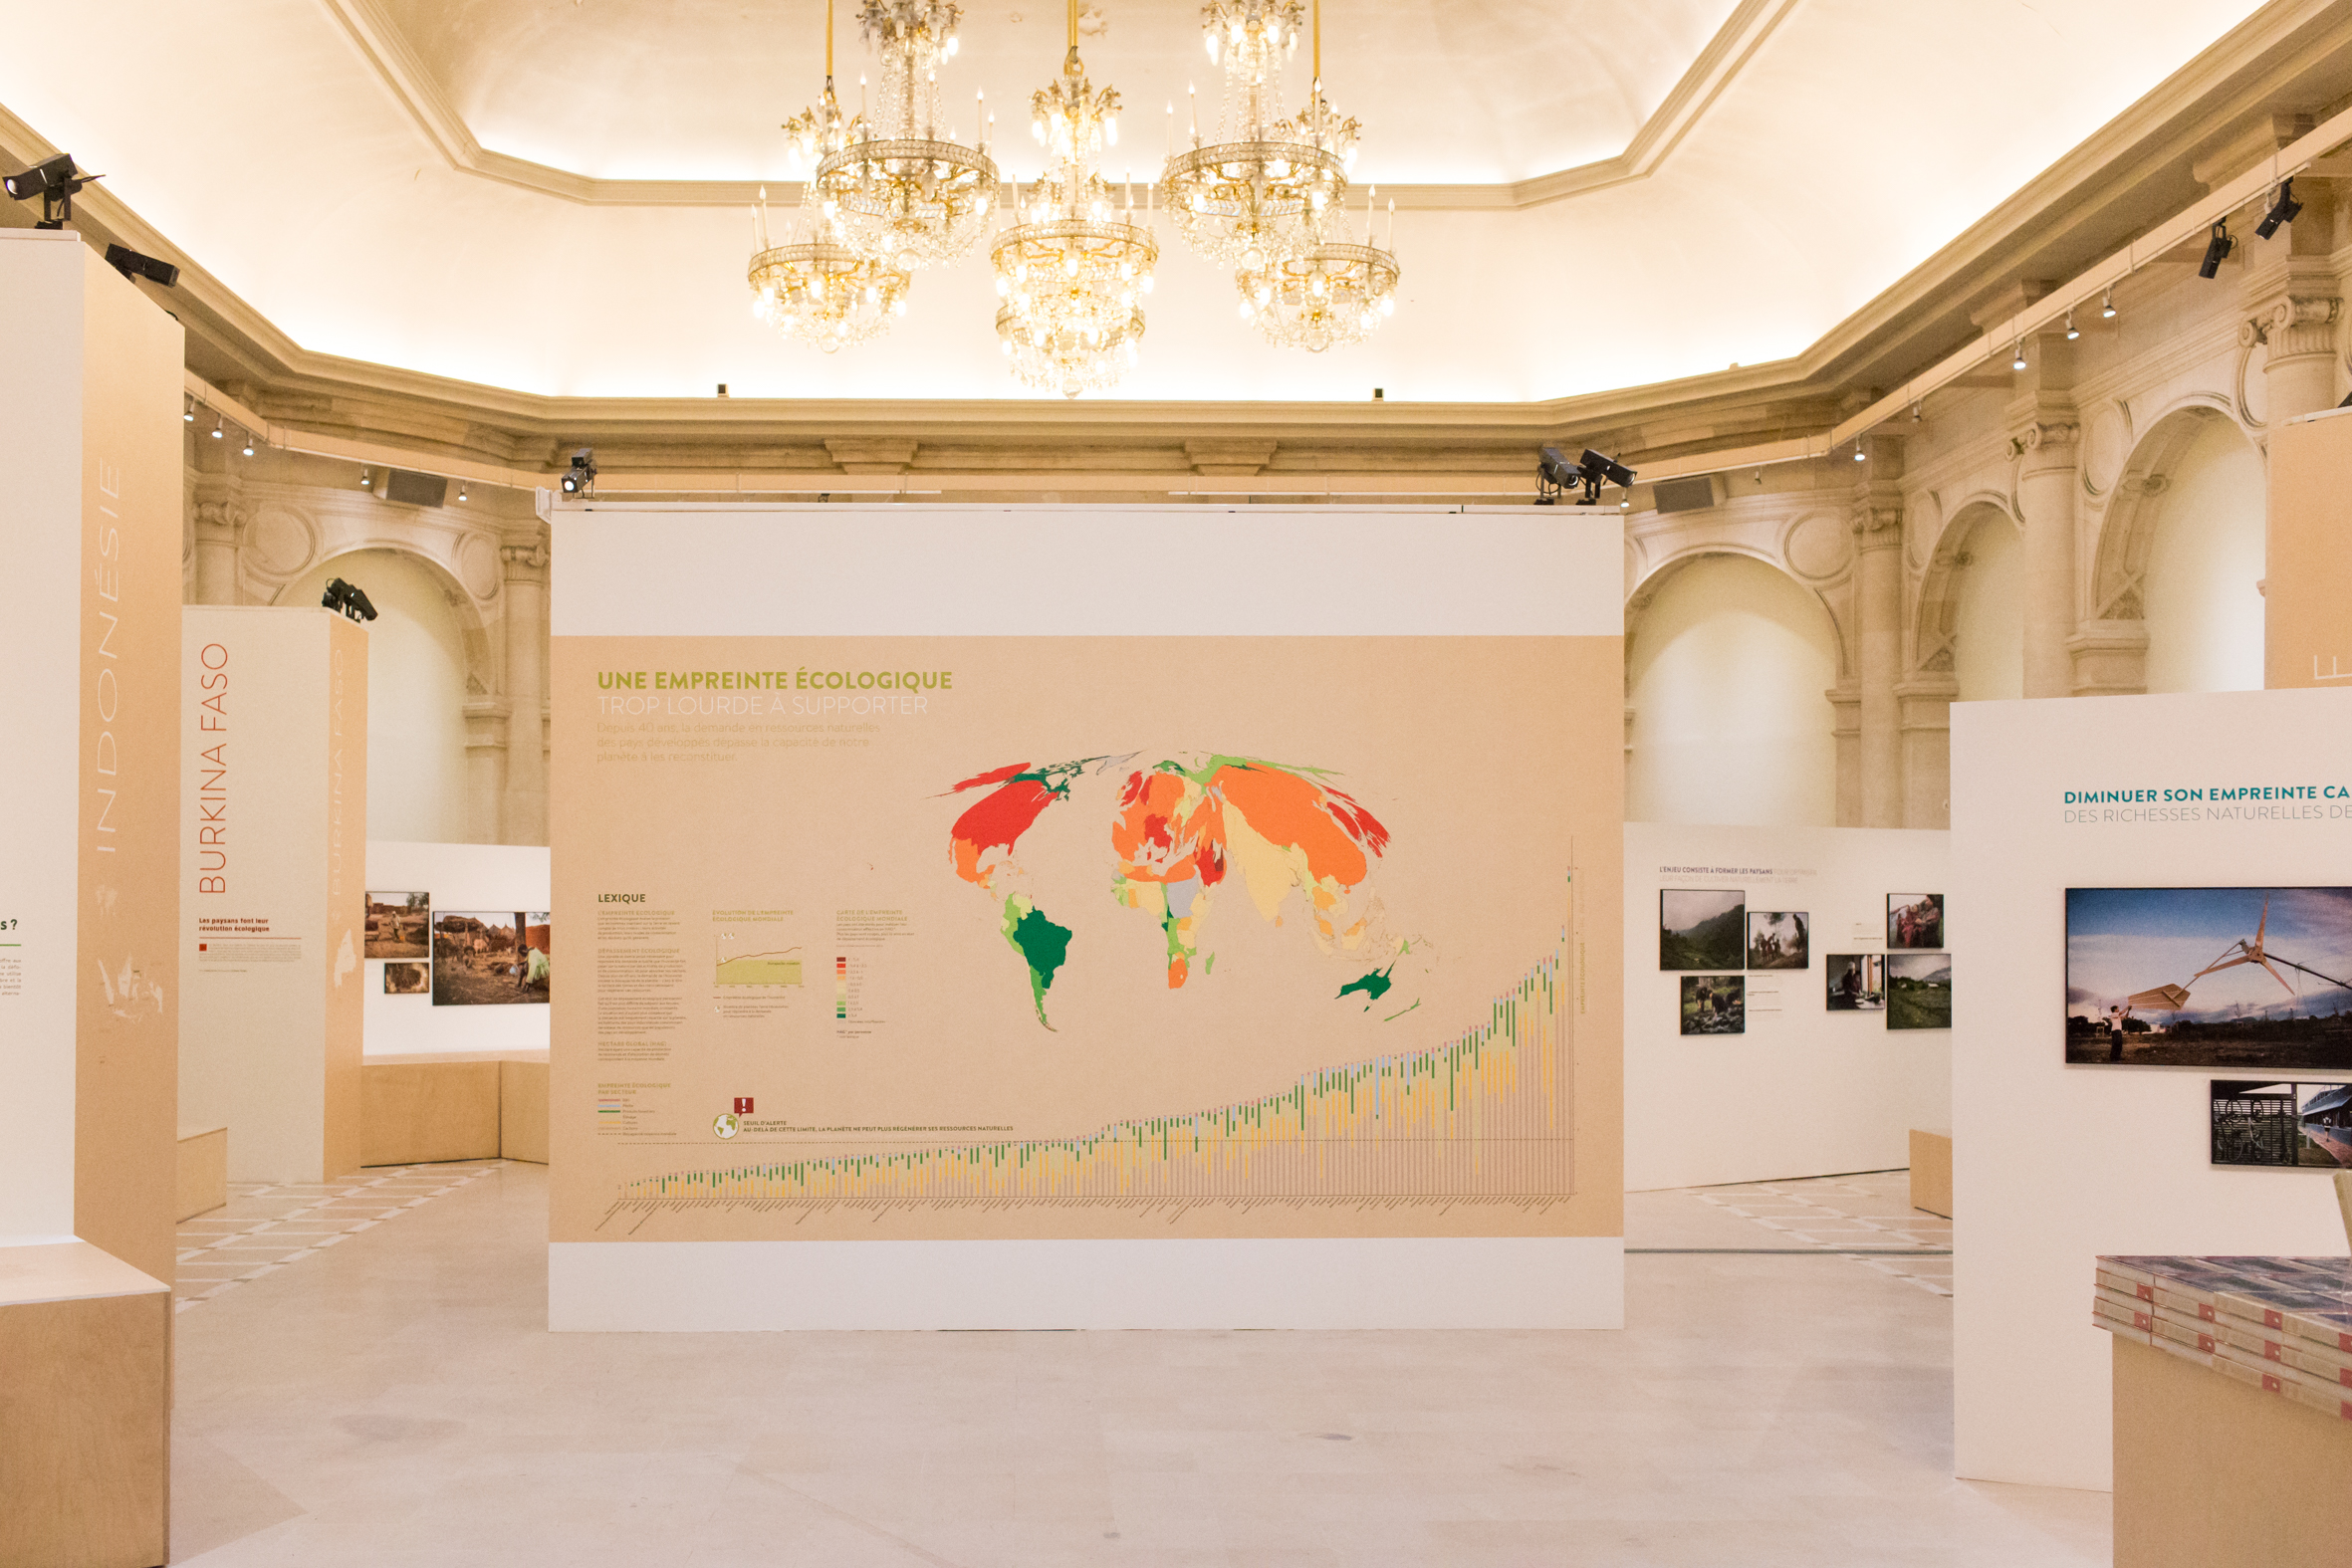
This thematic map shows two variables; 1) coloration indicates reserve(green) – deficit(red)1 of national biocapacity and 2) area indicates absolute consumption of biocapacity.
Consumption = Appropriated National Biocapacity + Imports - Exports

petit prince personal planetoid
The area of each country has been distorted to represent its consumption i.e.; its ecological footprint. Countries which appear larger than normal are consuming more than their fair earth share2 and smaller countries are consuming less3.
2003 (LPR06): Not yet available
2002 (LPR05+):
Small (800x512),
Large (1280x768)
The original cartogram is a business-as-usual extrapolation of the 2005 Living Planet Report's 2002 data to the then present (2005) population for each country. Subsequent versions do not continue this confusing practice, and are named for the year of the data and not the year the report was issued.
Regions for which there was insufficient data available (shown in blue on the 2002 map) were originally scaled by the global hectare/real hectare ratio (=1.1). Some regions for which footprint data was unavailable were mistakenly scaled by population en lieu of area. Luckily, most of these locales are very small/sparsely populated. In the raster (GIF, PNG) versions of the map, or vector versions at normal magnification, the effect is largely unnoticeable and most pronounced for: Guyana, Suriname, Oman, the Gaza Strip and the West Bank. Unpopulated regions e.g; Antarctica; were similarly scaled but confusingly colored as if they had no deficit. The 2003 map uses blue for any area without a (significant) population or calculated EF data.
I began these maps in the fall of 2006 after making the connection between my previous environmental mapping efforts and the asbtract environmental footprint I had been tasked to study as an intern at l'X.
The majority of the work is in combining national statistics from various data sources into a single database table, and joining this to a GIS country map set for use with a cartogram production software package such as MAPresso. With MAPresso I manually step the engine about 7 or 8 times, until the areas of two large countries seem to match the ratios of their EFs. The cartogram is produced this way in order to minimize distortion, before exporting it to EPS format for post-processing in a vector graphics package.
Once the initial map was completed I sent it to the WWF and it was linked to from the Living Planet Report (LPR) website. The WWF subsequently included their own version of an EF cartogram in the 2006 LPR.